2 Paper Trades
So in order to build my confidence and to help refine all my reading into an actual "action plan" I'm going to "paper trade" for 2 monts (technically 3 but December is historically a slow 'trading' month). Investopedia has a stock market simulator which starts you off with $100,000 imaginary dollars. I intend to follow all the same rules I will with my real money, the idea is to get comfortable enough with my decisions that I'm not fretting or second guessing myself when it really matters (with my money). So, below are the entry conditions for two trades I entered earlier this week ....
 First up is Verizon Wirless (VZ). You may notice the bars are colored "oddly". I've been experimenting with 'paintbars' in QuoteTracker and have put some to use. The price bars are colored according to the Impulse System set forth in Come into My Trading Room. Essentially, when both the 26-bar (in this case week) EMA and the MACD are increasing the bar is colored green. This indicates a strong uptrend as both averages are moving upward. When the EMA and MACD are both decreasing the bar is colored red, as a downtrend is in effect. If the EMA and MACD can't agree then the bar is blue. The Impulse gives more of a "don't" signal, when it's green (uptrend) don't go short, and vice versa. This keeps me from going 'against the grain' of a significant trend. As you can see in VZ to the left there is a pronounced uptrend with over a month of 'green'. Since this is a strong uptrend my options are to go long (buy) or stand aside. Both the DJIA and Telecom stocks have similar uptrends, AT&T (T) had a similar profile to VZ but AT&T had a worrysome signal I'll talk about below.
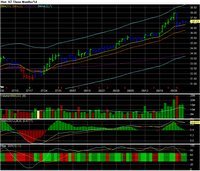 Which brings us to the daily view of VZ. After first asessing that the long-term trend was up (above in the weekly view), it's time to look for a good place to enter. The best place to buy during an uptrend is when the trend pulls back to (or temporarily below) the EMA. I plot both a 11 and 22 day EMA, when the prices are in between those it's a good place (assuming the remaining indicators still show a general uptrend). At the right edge of the chart you'll notice that the prices had dropped towards the EMA and hugged it for the last two days of the previous week. The MACD lines are still very positive (the boxed value indicated in the 3rd panel), and the Elder Force Index is on the rebound (the colored bars in the 4th panel have turned green, this is a paintbar I set up). This indicates a temporary pullback to the main upward trendline. So I entered an order to buy at 1/16th of a point above Friday's closing high, @ $37.29. My profit taking point is the upper channel (techincally envelope) line (the light blue), however I expect the stock to hug the EMA for a while as it did last month. My stop was initially set at $35.50, this seems a little low but is due to the recent correction to the EMA. This sudden return makes the stock appear more volitile to the equation I use to determin stops, so the stop is placed farther out to avoid daily volitility. As the trend progresses and becomes less volitile the stop will steadily increase.

The day I entered the VZ trade, Alcoa Inc (AA) started to look good. On the right you'll see the weekly chart. A steady fairly steady downtrend. While the MACD was rising slightly (turning the bars blue) it was still significantly negative. The downtrend should continue.
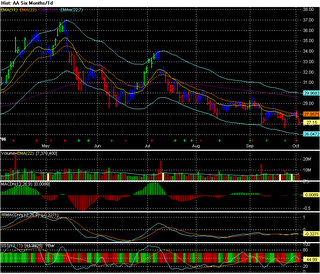 Now here's the daily chart for AA. This is one day after I entered the trade. You'll notice a small red arrow at the bottom of the price chart. This is a paintbar that I created. It samples Elder Force Index and the Slow Stocahstic; it's looking for a condition where the Stochastic 'reverses' direction and the EFI moves 'against' the trend. In a downtrend if the EFI becomes positive while the Stochastic begins a downtrend it's a good time to enter short. Add to that the daily impulse turning red also signaled a shorting opportunity. The only worrying condition is the long slow bullish divergence of the MACD histogram. Still the order was entered to short at 1/16th of a point below the daily low. Unfortunately the simulator order software became a little confused. I entered the order well after market close and specified a "One Day Only" order, for some reason the simulator started calculating the 'one day' from the time the order was entered not the time the market opened. When I arrived at work the next day the order had shown as expired despite the fact that the price had moved in my direction. I decided to enter a market order anyway; the end result I sold short at $27.30 instead of $27.52. We'll chalk that up to a learning experience, which is part of the reason I'm paper trading right now.
You may notice the little arrows show up a lot. I'm tweaking with the 'sensitivity' still. At first I had it trying to approximate what the weekly charts look like with only daily data (paintbars can't reference other timescales, I can't have a daily chart reference a weekly chart). I figured it would be easier to censor them manually. If the weekly chart is saying "NO shorting" I'll ignore the shorting signals (something I forgot on the proposed AT&T trade earlier), and vice versa.
Current Trades
Trading Account Summary
 First up is Verizon Wirless (VZ). You may notice the bars are colored "oddly". I've been experimenting with 'paintbars' in QuoteTracker and have put some to use. The price bars are colored according to the Impulse System set forth in Come into My Trading Room. Essentially, when both the 26-bar (in this case week) EMA and the MACD are increasing the bar is colored green. This indicates a strong uptrend as both averages are moving upward. When the EMA and MACD are both decreasing the bar is colored red, as a downtrend is in effect. If the EMA and MACD can't agree then the bar is blue. The Impulse gives more of a "don't" signal, when it's green (uptrend) don't go short, and vice versa. This keeps me from going 'against the grain' of a significant trend. As you can see in VZ to the left there is a pronounced uptrend with over a month of 'green'. Since this is a strong uptrend my options are to go long (buy) or stand aside. Both the DJIA and Telecom stocks have similar uptrends, AT&T (T) had a similar profile to VZ but AT&T had a worrysome signal I'll talk about below.
 Which brings us to the daily view of VZ. After first asessing that the long-term trend was up (above in the weekly view), it's time to look for a good place to enter. The best place to buy during an uptrend is when the trend pulls back to (or temporarily below) the EMA. I plot both a 11 and 22 day EMA, when the prices are in between those it's a good place (assuming the remaining indicators still show a general uptrend). At the right edge of the chart you'll notice that the prices had dropped towards the EMA and hugged it for the last two days of the previous week. The MACD lines are still very positive (the boxed value indicated in the 3rd panel), and the Elder Force Index is on the rebound (the colored bars in the 4th panel have turned green, this is a paintbar I set up). This indicates a temporary pullback to the main upward trendline. So I entered an order to buy at 1/16th of a point above Friday's closing high, @ $37.29. My profit taking point is the upper channel (techincally envelope) line (the light blue), however I expect the stock to hug the EMA for a while as it did last month. My stop was initially set at $35.50, this seems a little low but is due to the recent correction to the EMA. This sudden return makes the stock appear more volitile to the equation I use to determin stops, so the stop is placed farther out to avoid daily volitility. As the trend progresses and becomes less volitile the stop will steadily increase.
The day I entered the VZ trade, Alcoa Inc (AA) started to look good. On the right you'll see the weekly chart. A steady fairly steady downtrend. While the MACD was rising slightly (turning the bars blue) it was still significantly negative. The downtrend should continue.
 Now here's the daily chart for AA. This is one day after I entered the trade. You'll notice a small red arrow at the bottom of the price chart. This is a paintbar that I created. It samples Elder Force Index and the Slow Stocahstic; it's looking for a condition where the Stochastic 'reverses' direction and the EFI moves 'against' the trend. In a downtrend if the EFI becomes positive while the Stochastic begins a downtrend it's a good time to enter short. Add to that the daily impulse turning red also signaled a shorting opportunity. The only worrying condition is the long slow bullish divergence of the MACD histogram. Still the order was entered to short at 1/16th of a point below the daily low. Unfortunately the simulator order software became a little confused. I entered the order well after market close and specified a "One Day Only" order, for some reason the simulator started calculating the 'one day' from the time the order was entered not the time the market opened. When I arrived at work the next day the order had shown as expired despite the fact that the price had moved in my direction. I decided to enter a market order anyway; the end result I sold short at $27.30 instead of $27.52. We'll chalk that up to a learning experience, which is part of the reason I'm paper trading right now.
You may notice the little arrows show up a lot. I'm tweaking with the 'sensitivity' still. At first I had it trying to approximate what the weekly charts look like with only daily data (paintbars can't reference other timescales, I can't have a daily chart reference a weekly chart). I figured it would be easier to censor them manually. If the weekly chart is saying "NO shorting" I'll ignore the shorting signals (something I forgot on the proposed AT&T trade earlier), and vice versa.
What is it? BlahBlah
Ticker: XXXX
Cost: $X.XX
Value: $X.XX
Exit Point: $X.XX
Current Balance: $5,000.00
Current Value: $X.XX
Highest Value: $X.XX
Lowest Value: $X.XX
Highest Drawdown: XX%
posted by Jeremy at 8:07 PM
9 comments
![]()
![]()