S&P 500 General Analysis
Slight change in programming, I'll start with the general market trends.
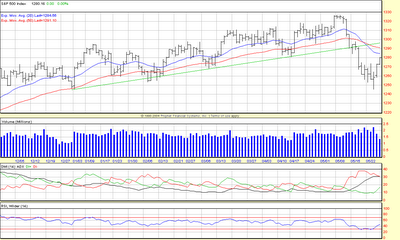
The above chart covers the past 6 months. The top portion shows the price of the index, followed by the trading volume, then the Average Directional Index, lastly the Relative Strength index. The blue line on the price chart is a 20 day Exponential moving average, the red line a 50 day exponential moving average, the green line is hand-drawn to show the previous general up-trend and lower trading channel of the index.
So what does it all mean?
As the green line demonstrates there is a gentle long term uptrend. If we plotted price data on a weekly basis instead of daily this would be more obvious, and it would also be indicated in an ADX value rising steadily towards 40. This is further supported by noticing that the price will increase then fall back to the 50 day moving average. Since this uptrend is a very gentle slope, the market can be considered trending "sideways" in the near term (weeks, instead of several months).
But what about the recent downturn?
As you can see the recent downturn took prices below the green trendline, as well as below the moving averages. The downturn found support near the 1265 price mark, this value also provided support back in January and February. In the very near term (days, maybe 2 weeks) I expect the price to return to the moving averages and perhaps touch the green trend line again. Where it goes from there depends a lot on the trading volume during the coming days. If the "return move" is conducted on high volume this will indicate a strong short term uptrend. If the return is accompanied by low trading volume then it is likely the market will continue it's downwards fall (the next question then becomes, will it find support at 1265 again?). Since the most recent minor uptrend has been on decreasing volume, I predict the later option.
So why should I know this?
The general 'wisdom' is "don't fight the trend", if the market as a whole is in a down trend so will a majority of the stocks I'm going to examine; those stocks that appear to be moving against the general trend will have to have strong indications that the move will take place.
Prediction for next week: The S&P500 index will continue it's slight rise until it meets it's moving average values. After that it depends largely on next weeks' trading volume.
Up next, the Dow Jones Industrial Average ...
posted by Jeremy at 10:33 PM
![]()
![]()


0 Comments:
Post a Comment
<< Home